Who's Really Winning at Longevity?
Analyzing Bryan Johnson, Siim Land, and My Own Results
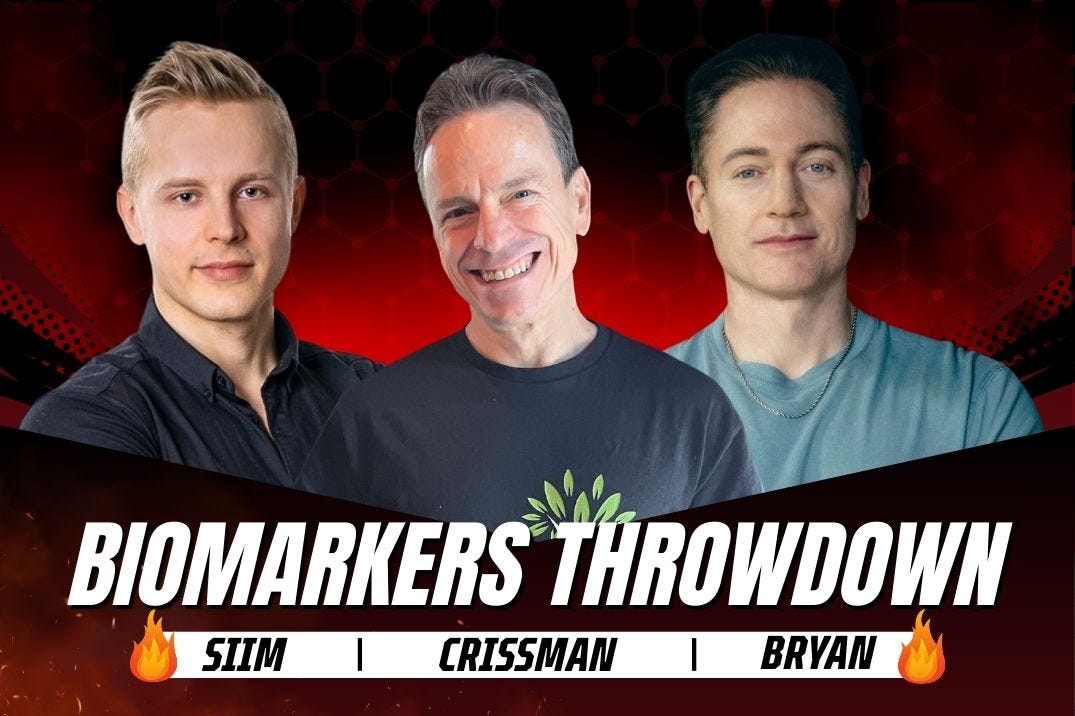
The longevity space has become a spectator sport. Bryan Johnson spends $2 million annually and takes 100+ supplements daily, regularly posting detailed biomarker updates. Siim Land combines biohacking with athletic performance and recently responded to Bryan's posts with his own comprehensive biomarker comparison1. Meanwhile, I've been testing whether minimal interventions can match their results.
Inspired by their biomarker transparency, I compiled data from all three of us. The results challenge common assumptions about what optimization requires.
The Investment Gap
When Siim published his superior biomarkers compared to Bryan, critics dismissed them: "Yeah, but you're 18 years younger." Here's what makes this comparison interesting: I'm 6 years older than Bryan.
Consider the inputs by age:
Siim Land (29 years old):
6 regular supplements
$100 monthly cost (supplements cost)*
4 hours weekly exercise
11,000 daily steps
Bryan Johnson (47 years old):
100 daily supplements
$170,000 monthly cost (???)
6 hours weekly exercise
4,000 daily steps*
My approach (53 years old):
1 daily supplement (potassium)
$60 monthly cost (gym membership)
1.5 hours weekly exercise
20,000 daily steps
*guesstimated
So we have a 53-year-old spending 3,000x less money and a quarter of the time in the gym compared to a 47-year-old, but walking 5x more. How do you think the biomarkers will compare?
Methodology: Creating Comparisons
Comparing biomarkers requires normalization since optimal ranges vary. For the charts, I scored each marker on a 0-100 scale where:
70-95: Within optimal range
30-70: Within normal but not optimal
Below 30: Outside normal range
I reversed the direction for biomarkers where lower is considered better, such as cholesterol measures.
Category Winners: Where Each Approach Excels
Metabolic Health
The metabolic markers are remarkably similar across all three of us:
HbA1c: Bryan 5.1%, Siim 4.9%, Me 5.0% (all within optimal range)
Fasting glucose: Bryan 97, Siim 80, Me 86 mg/dL (all normal)
Uric acid: Bryan 4.2, Siim 5.1, Me 5.2 mg/dL (all normal)
Siim edges ahead with perfect homocysteine at 5.6 μmol/L. Mine runs high at 11.5 μmol/L—something I haven't addressed yet. Despite Bryan's extensive methylation support supplements, we're achieving essentially identical metabolic health.
Cardiovascular Fitness
Siim's combination of heavy training and younger age shows:
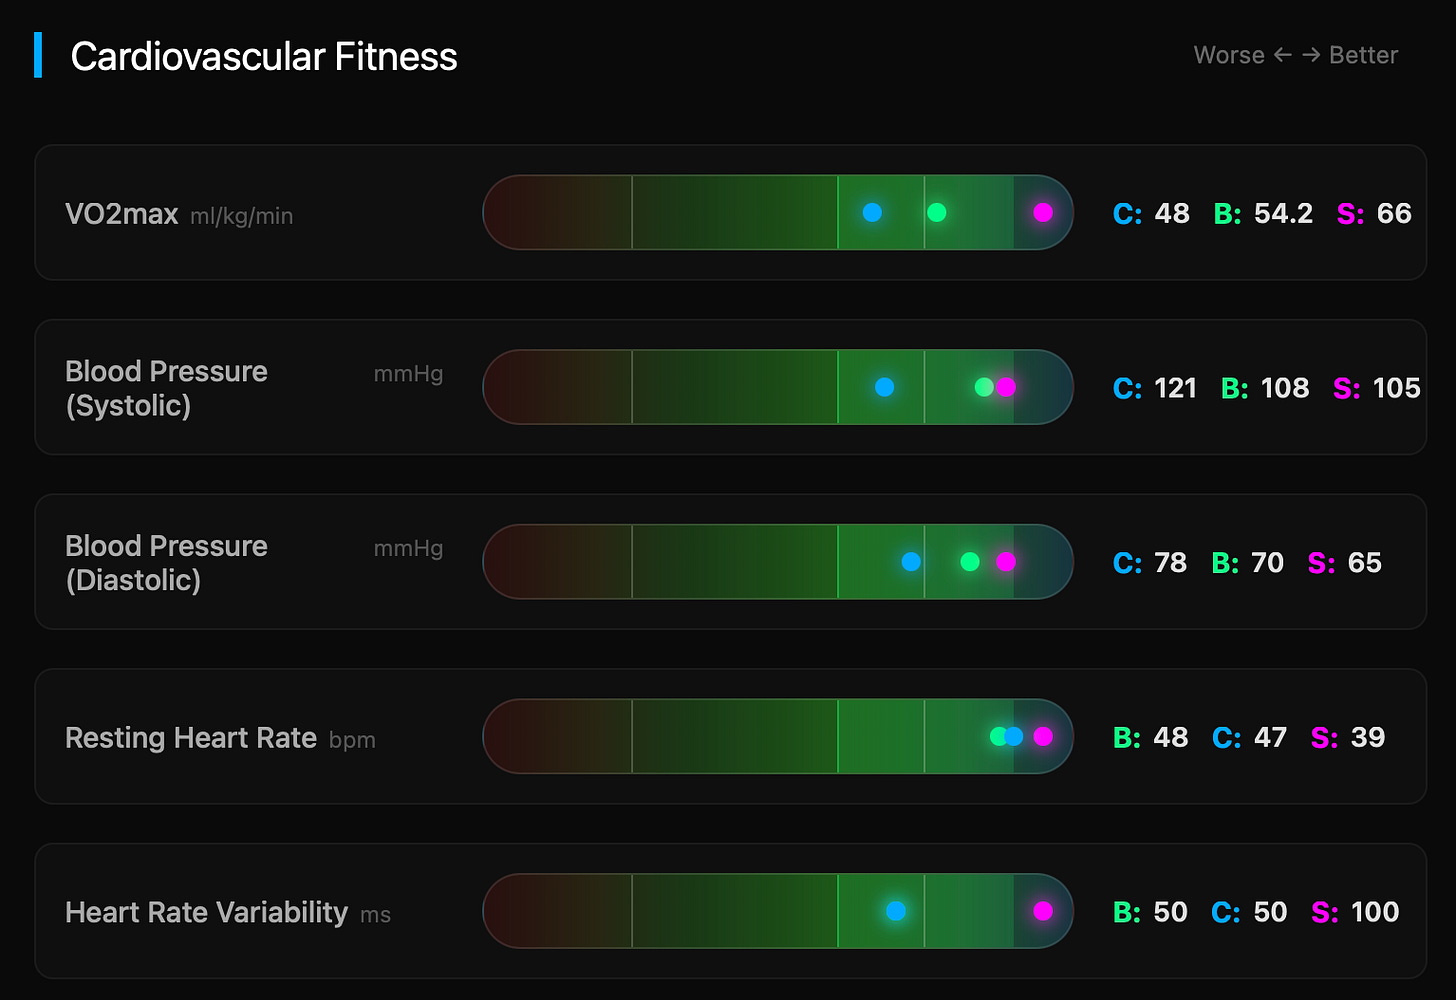
VO2max: 66 ml/kg/min (99th percentile)
Resting heart rate: 39 bpm
HRV: 100ms
Bryan achieves solid fitness (VO2max 54.2) with his protocol. My current VO2max of 48 reflects lower cardio training. I do a mix of aerobic and high-intensity interval training for less than an hour weekly. When I was training for my marathon, my VO2max reached 61.5, demonstrating how quickly this marker responds to dedicated training.
My blood pressure is higher than I would like it, at 121/78. That's down from 126/83, thanks to taking potassium citrate supplements, my single longevity supplement.
Inflammation Markers
Here's where minimal intervention shines:
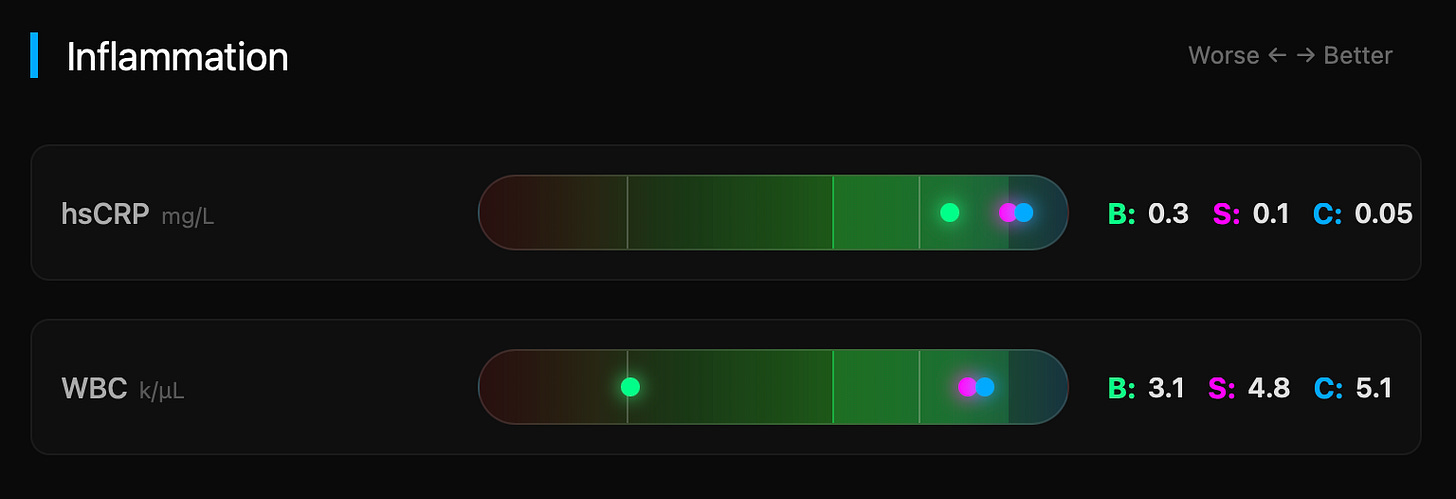
hsCRP: 0.05 mg/L (Bryan: 0.3, Siim: 0.1)
Optimal inflammation despite no anti-inflammatory supplements
This ultra-low inflammation likely comes from 20,000 daily steps. Walking reduces inflammatory cytokines through multiple pathways including improved insulin sensitivity and reduced visceral fat2.
Lipid Panel
The lipid story is complex:
ApoB (cardiovascular risk): Siim wins at 58 mg/dL
HDL-C: I lead at 113 mg/dL
Triglycerides: Siim optimal at 39 mg/dL
My HDL of 113 mg/dL exceeds even the "optimal" range—a direct result of 20,000 daily steps. HDL increases somewhat linearly with step count3, and with 20,000 steps daily , the elevation is dramatic. High HDL levels can be caused by heavy alcohol consumption or overtraining. Given my moderate alcohol consumption and normal level of aerobic exercise, my HDL levels are likely protective.
Aging Biomarkers
Bryan's Dunedin PACE shows 0.67 (aging at 67% normal speed), though he takes this test frequently and may be optimizing for it. The test creators acknowledge that only supplementation moves this metric, not diet or exercise, which raises questions about its validity as a comprehensive aging marker.
My Dunedin PACE varied from 0.8 to 0.98 across two tests, showing significant variability. Siim's 0.62 is impressive but again, without supplementation, this metric may not capture the full picture of biological aging.
Bryan's other aging markers:
Telomere length: 11.4kb
PhenoAge: 8.7 years younger
These metrics suggest his supplementation protocol impacts aging biomarkers, though whether this translates to actual longevity remains unknown.
The Surprising Standouts
Liver Function
AST: 32 IU/L (Bryan: 24, Siim: 23)
ALT: 30 IU/L (Bryan: 21, Siim: 23)
GGT: 23 U/L (Bryan: 8, Siim: 11)
ALP: 47 IU/L (optimal range, all three similar)
Albumin: 4.8 g/dL (Bryan: 4.5, Siim: 4.6)
While Bryan and Siim have lower transaminases, all values are well within healthy ranges. My slightly higher but still normal AST/ALT likely reflects moderate alcohol consumption rather than liver stress.
Kidney Function
Despite Siim's concerns about Bryan's kidney health from extensive supplementation, the data shows mixed results:
eGFR: Siim 112, Me 82, Bryan 74 mL/min
Cystatin-C (creatinine-neutral metric): Bryan 0.87, Me 0.82, Siim 0.67 mg/L
Bryan's cystatin-C is still slightly below median for his age, suggesting his lower eGFR might reflect high muscle mass or creatine supplementation affecting creatinine levels rather than true kidney dysfunction. Siim shows the best overall kidney markers.
Strength Performance
Siim dominates:
Bench press: 136kg
Squat: 160kg (tied with me)
Grip strength: 68.1kg
Bryan's numbers (bench 109kg, squat 115kg4, grip 59.9kg) reflect his unconventional training approach. He avoids traditional compound lifts like squats and deadlifts in favor of trendy exercises like backward sled pulls. While this may reduce injury risk, it appears to compromise traditional strength metrics like grip strength.
This demonstrates that targeted strength training with basic compound movements outweighs any supplement protocol for building functional strength.
Body Composition & Bone Density
Bone mineral density (BMD) tells an interesting story:
BMD T-scores: Siim 1.54, Bryan 1.47, Me 1.156
Both Siim and Bryan have excellent bone density. Siim lifted from a young age, while Bryan was previously overweight—both factors that boost BMD. As someone who's always been thin, my first BMD check at 44 showed borderline osteopenia, over 1 standard deviation below expected for age. Since then, I've been hitting the gym hard and have improved to the 40th percentile—proof that bone density can be improved even in your 40s with dedicated strength training.
Visceral fat shows all three of us in healthy ranges:
Siim: 0.25L (exceptional)
Me: 0.51L
Bryan: 0.56L
Cost-Benefit Analysis (A Tongue-in-Cheek Calculation)
Let's have some fun with the numbers. Calculating biomarker improvement per dollar spent monthly:
Bryan Johnson:
Normalized biomarker score: 65
Cost: $170,000/month
Efficiency: 0.00038 points per dollar
Siim Land:
Normalized biomarker score: 78
Cost: $300/month
Efficiency: 0.26 points per dollar
My approach:
Normalized biomarker score: 67
Cost: $60/month
Efficiency: 1.12 points per dollar
By this admittedly arbitrary metric, I achieve 3,000x better efficiency than Bryan and 4.3x better than Siim in biomarker optimization per dollar spent. Of course, this assumes all biomarkers are equally weighted and that normalized scores translate directly to health outcomes—both questionable assumptions. But it illustrates the diminishing returns of extreme optimization.
The Unaging Challenge
Want to build the habits that actually matter without the massive price tag? The Unaging Challenge focuses on the fundamentals that drive real results: progressive aerobic fitness, structured strength training, daily walking targets, and sustainable dietary changes. No 100-pill protocols, no $170,000 monthly bills—just evidence-based habits you can maintain for life.
Ready to prove that age is just a number? Join the 2026 Unaging Challenge. Subscribe to the newsletter to be informed when starting.
The Final Rankings
Remember that question from the beginning? Who has better biomarkers—the 47-year-old spending $170,000 monthly and 6 hours weekly in the gym, or the 53-year-old spending $60 monthly and a quarter of that time in the gym?
Across the 50+ biomarkers we compared, here's the final count:
First Place: Siim Land - Superior in 28 out of 50 biomarkers. His combination of youth, athletic training, and moderate biohacking creates optimal results across the board.
Second Place: Crissman (me) - I beat Bryan in 27 out of 50 biomarkers, despite being 6 years older and investing 3,000x less money and a quarter of the gym time. The difference? 20,000 daily steps and focusing on fundamentals rather than experimental treatments.
Third Place: Bryan Johnson - Beats me in 23 out of 50 biomarkers. His $170,000 monthly investment yields diminishing returns, with his best performance limited primarily to aging biomarkers that respond to supplementation.
The longevity leaders are running different races. Bryan's racing against death itself. Siim's racing for peak performance. I'm demonstrating that the fundamentals alone get you 90% of the way there—at any age, for 3,000x less money.
Start with walking. Add strength training. Fix your sleep. Then, and only then, consider whether the final 10% is worth 3,000x the investment.
Remember: the best longevity protocol is the one you'll actually follow for the next 50 years. Choose accordingly.


